Here’s a story about our foray into the wild world of the technology industry and how we ended up with our very first Minimum Viable Product (MVP).
It all started in March 2020, when the pandemic hit and the idea for a Covid-19 dashboard came to light. The idea was to show the data in an interactive and dynamic way. We wanted to show the intercorrelations between hospitals, patients, towns and regions in analysing the risk of overcrowding in hospitals during the pandemic, while overseeing the remaining public health resources, in real time. At first, we tried to use existing software, however it had not yielded the desired results. After initial testing, we found risk and performance management control could not be shown as envisaged.
In the video below you will be able to see our first presentation video we designed in the beginning of April. This was the idea for our first dashboard, which has changed significantly since then.
To incorporate more flexibility into the solution we started to design our own engine, which would offer a new dimension to risk and performance management visualisation. We wanted a product that would aggregate and interpret heterogenous data and output an intuitive visual simulation. The model would be updated in real time and would be able to provide an evolving picture of risks that empowers users to make the right decision at the right time.
At this stage we knew we needed to bring in an experienced programmer, capable of advancing our algorithm and programming requirements. We were very lucky because right off the bat, we got the man for the job. He has helped us build the heart of our product, the engine. The idea for the engine was to compare real time data against optimal values. This would help us to estimate deviation from optimal results. The reporting would work on the Traffic Light System (Red, Amber, Green), where the level of warning would go from green to red, depending on the deviation of real-time values in comparison to optimal results. The criteria in which we capture real-time data for, is interconnected in a tree, reproducing relationships between values. When we ran the values through our new engine, we were able to simulate what went wrong and most importantly, in real time, why. Having our first version of the engine running, we started building on data visualisation.
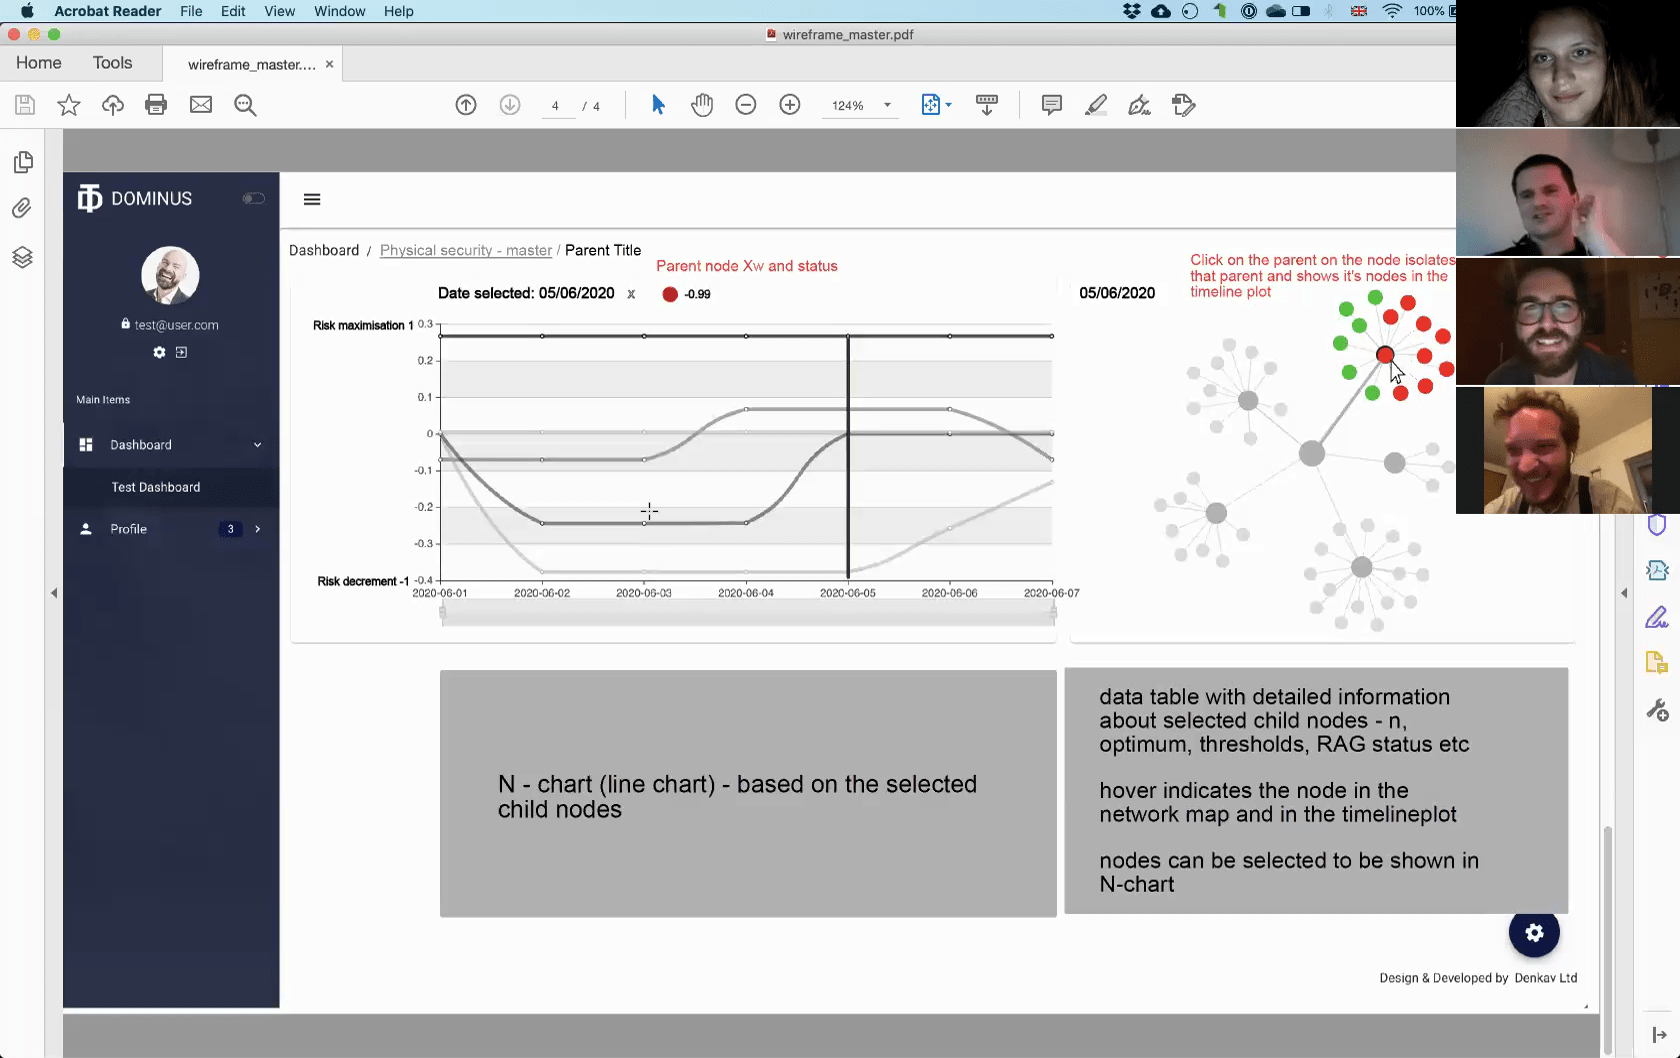
Building a new dashboard required new prowess. In recruiting a crucial new member we have used their capabilities to build a web app, envisaged to be the window to the data cruncher, for the engine. All the criteria connected in the network have their Traffic Light status propagated from bottom to top; giving users the ability to spot anomalies in the very finite depths of the system, to the highest level of overall performance and everywhere in between.
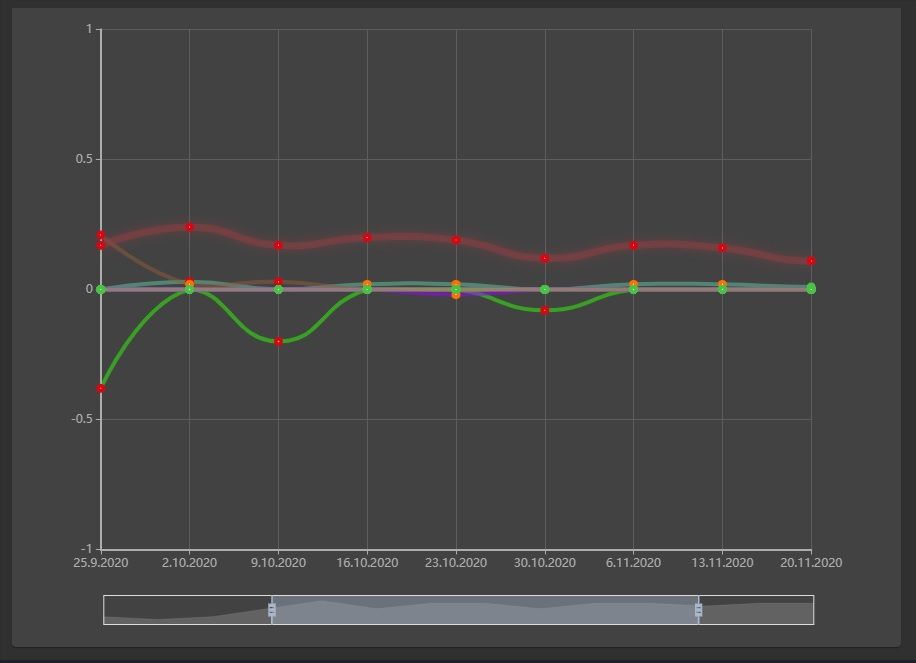
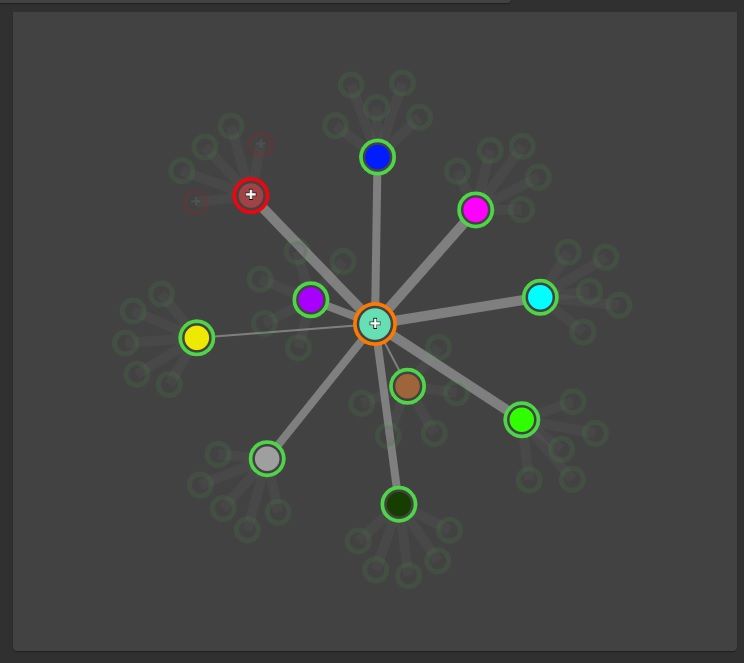
Performance is visualised in a timeline plot, allowing users to identify how the problems arise through time and we visualise the performance of the whole system in a network plot; giving users ability to investigate where the anomaly took place within the interconnected network of criteria. Furthermore, we are now able to track which criteria is over/under-performing; giving our solution an extra edge.
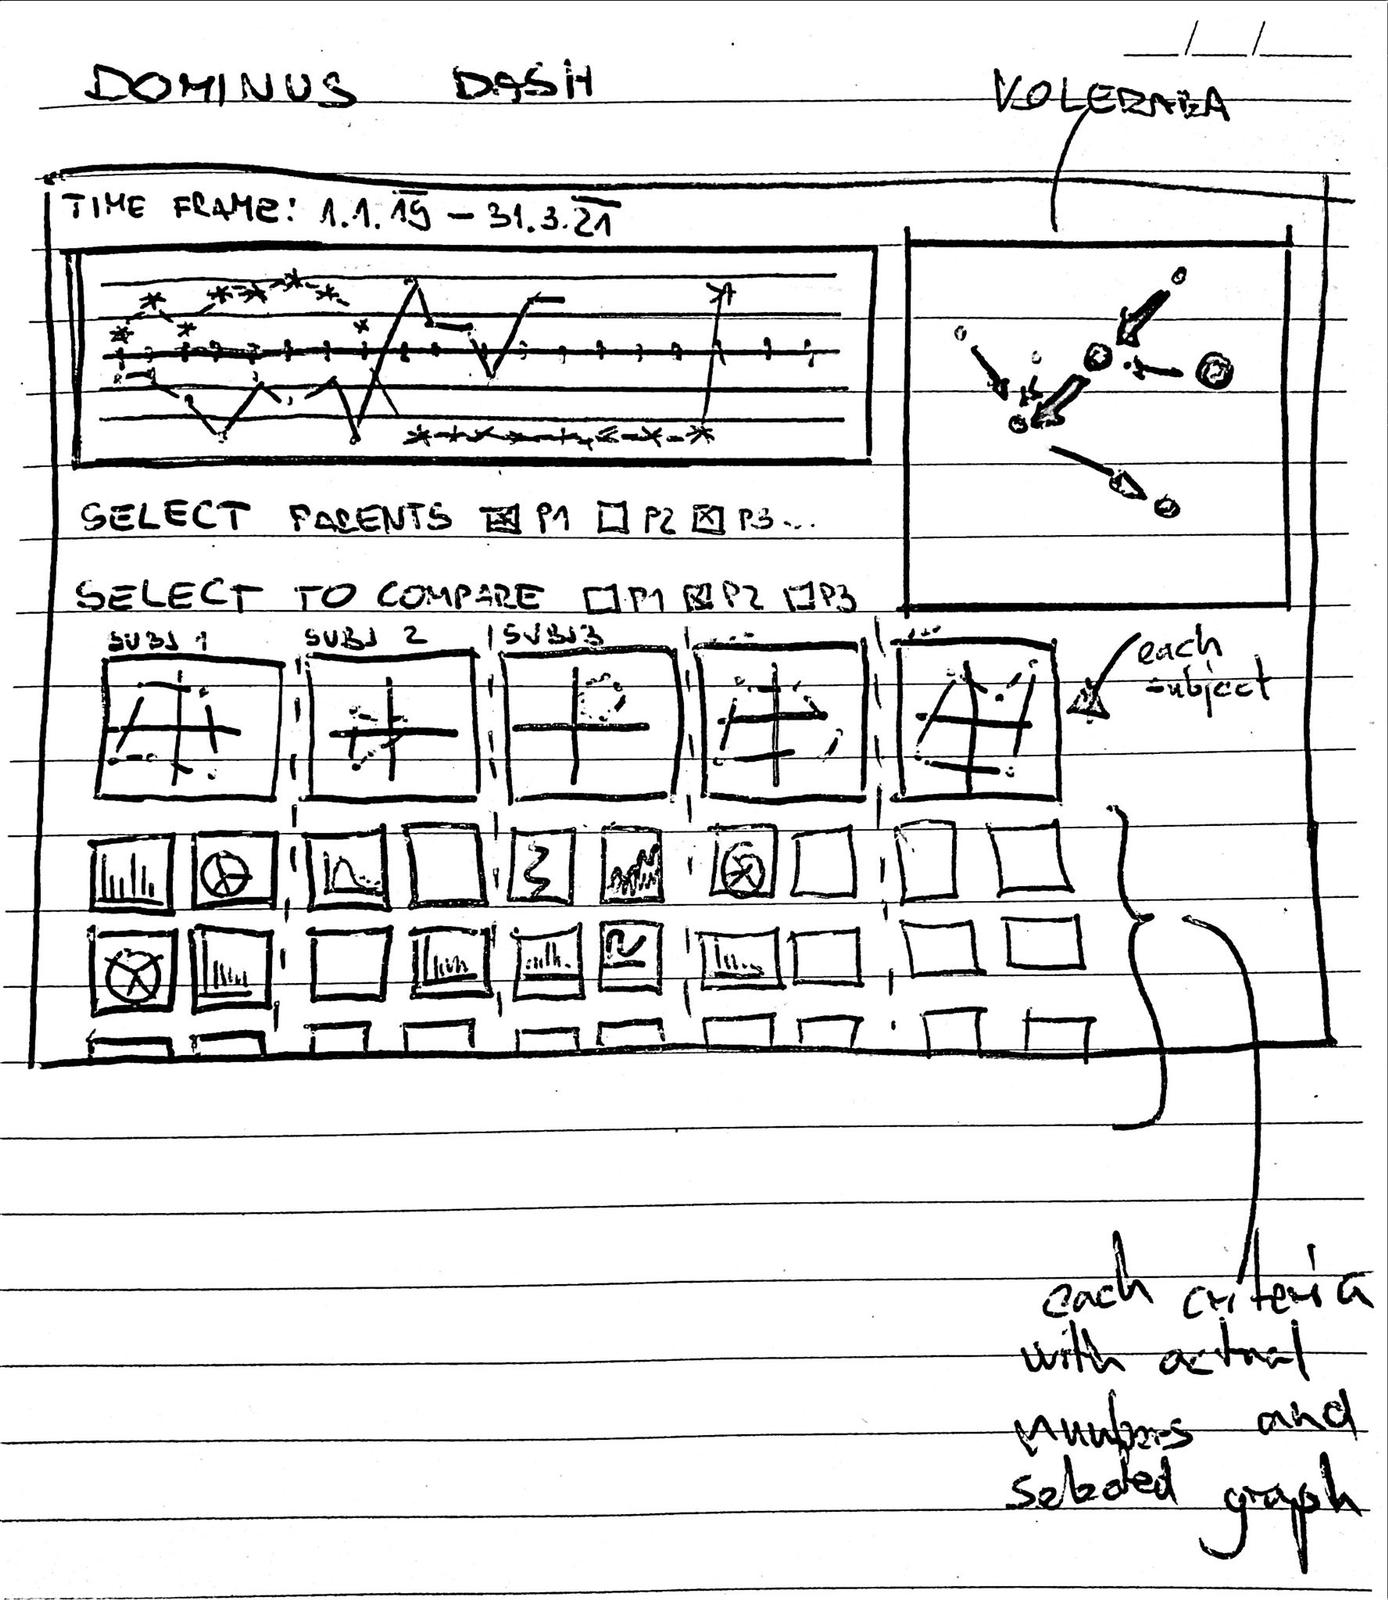
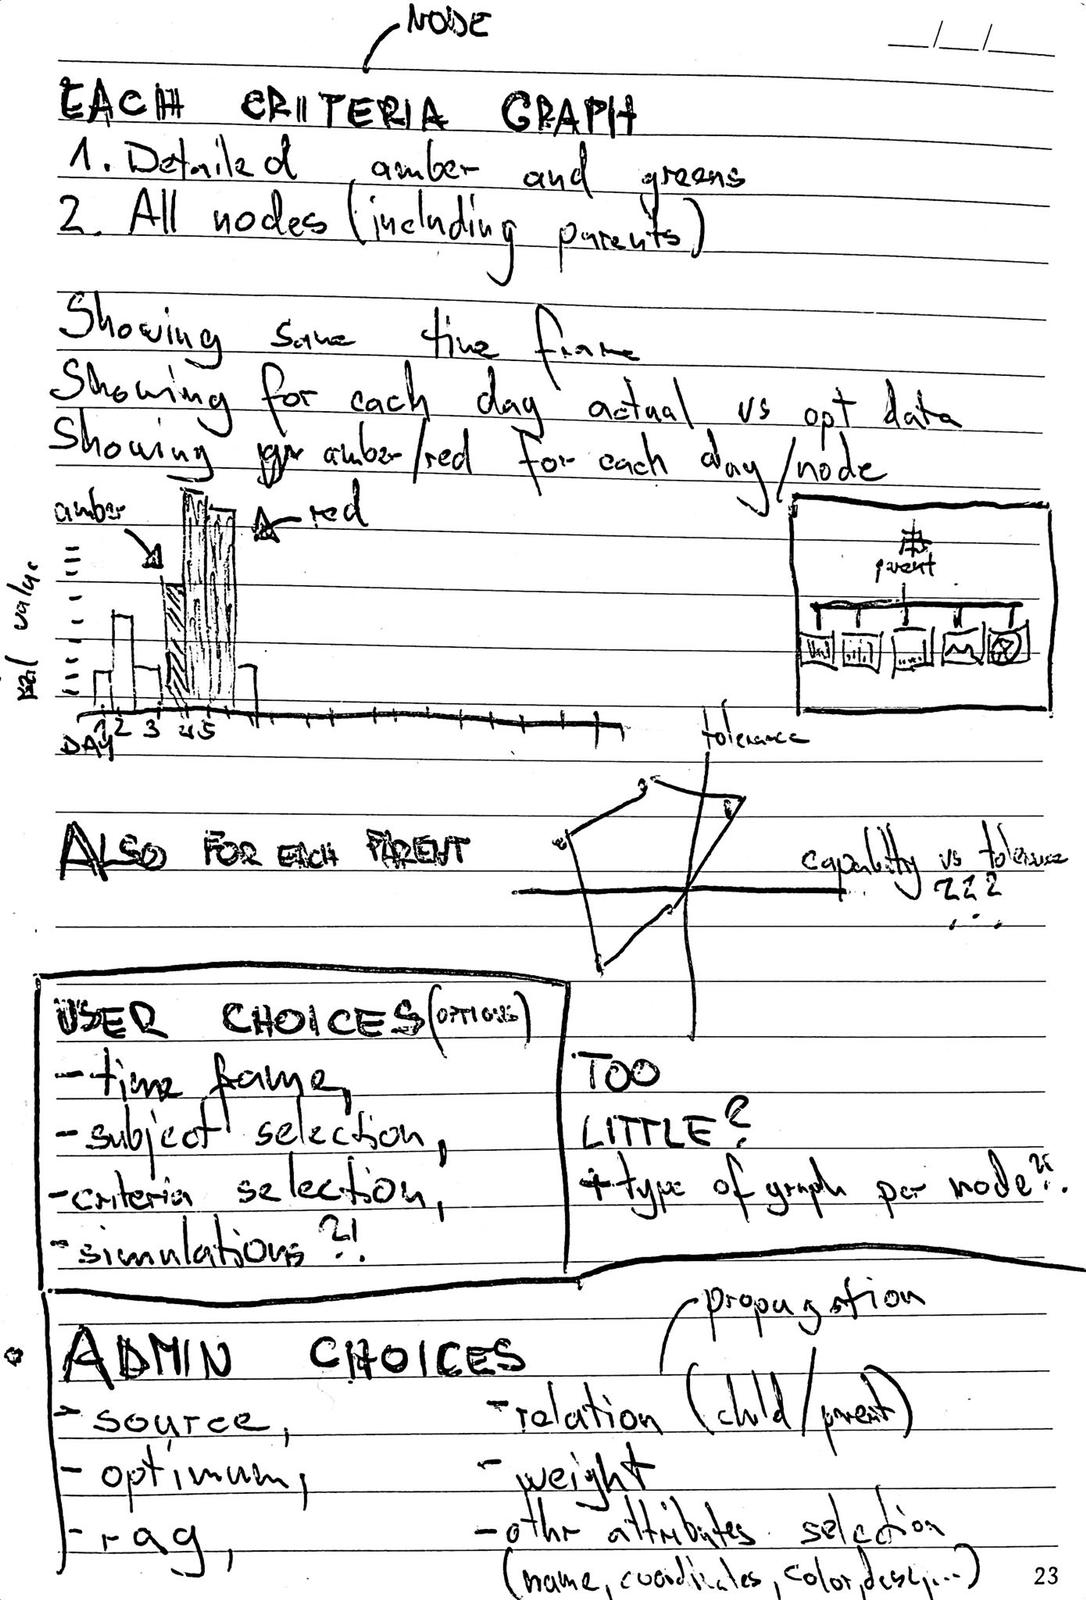
The above mentioned concept started on a piece of paper. It was just a drawing with a few bullet points describing basic functionalities. After building it and weeks of tests, our first functional version of Minimum Viable Product became a reality. On August 15th 2020- EYE (Everything you Endeavour) was born. Of course it was not easy, nor quick. There were a few disjointed stages and every fortnight we sat down, looked at the product and discussed improvements and adjustments.
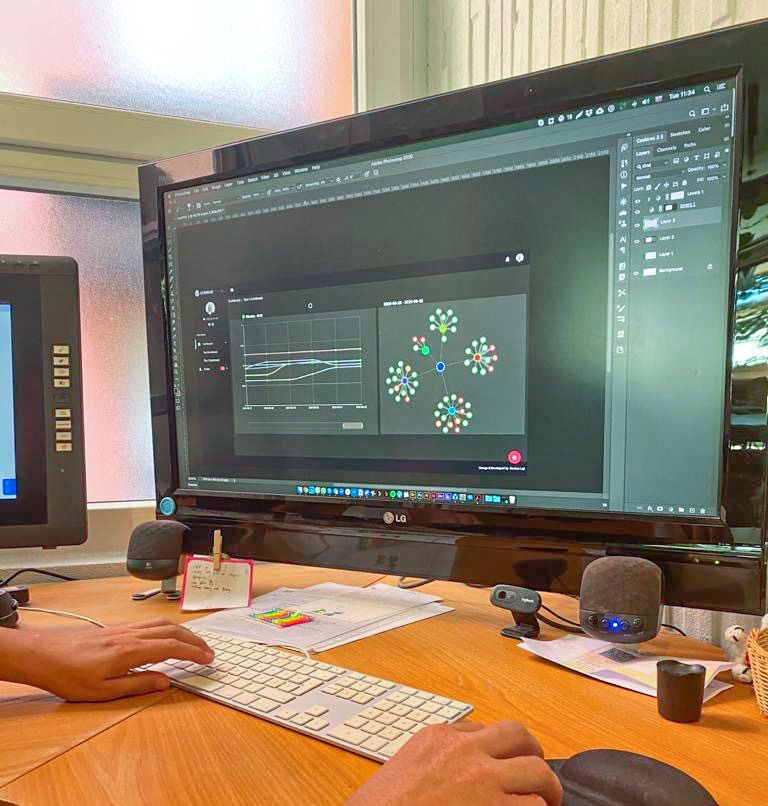
As the product evolves, we are patiently watching it march towards its envisaged potential. At this stage, it is an amazing tool for different fields of risk management. The EYE already has a web application. Users have control on who sees what data, based on their needs and it is already a product that already delivers delight to our first client. We are ecstatic about seeing it live and in use.